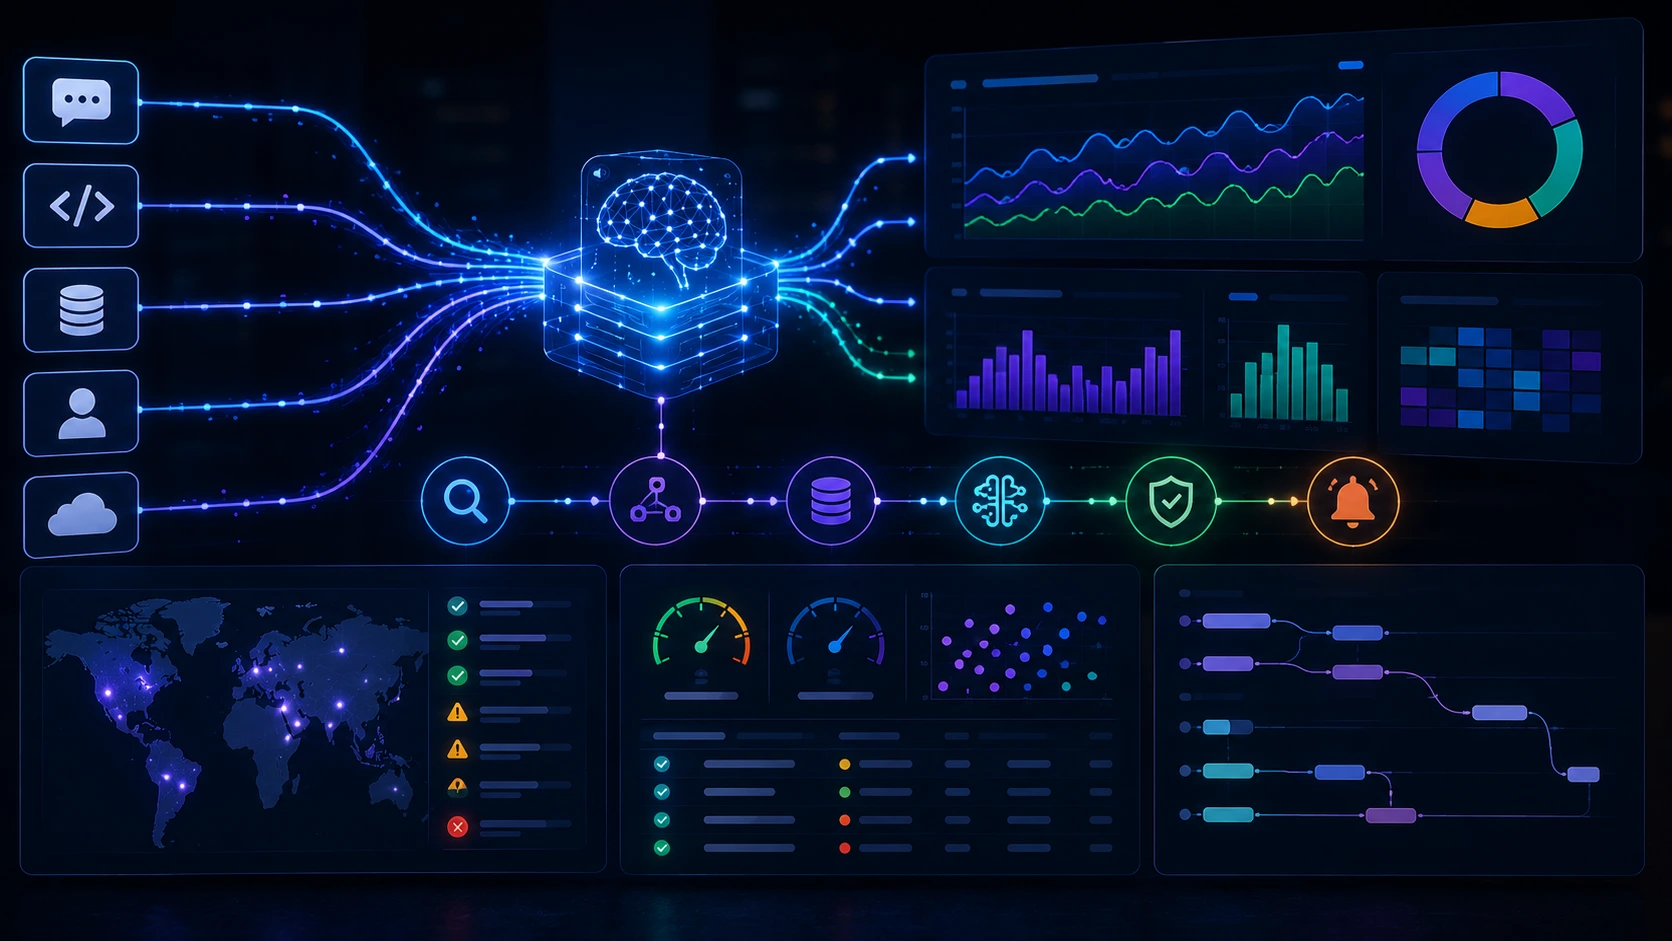
Automated workflows do work that used to happen in people’s heads: they touch systems, transform data, and trigger side effects. That makes them powerful—and risky—because failures can silently break business processes. Observability for automation workflows isn’t just about recording failures; it’s about collecting the right signals and turning them into alerts that surface real problems without waking the team for every transient blip.
Start by deciding what “healthy” means for your workflows
Before instrumenting, define meaningful objectives: what outcomes must the workflow produce, and how quickly? Those objectives become the basis for metrics, SLOs, and alerting tiers. For example, an invoice-processing workflow might have an objective to process 99% of invoices within 30 minutes; a nightly sync job might tolerate longer tail latency but must complete before business hours.
Key signals to collect
Collect a mix of metrics, logs, traces, and events. Each signal answers different operational questions.
Metrics (high-level, aggregated)
- Workflow runs: total started, succeeded, failed, cancelled. Track these per workflow type and per version.
- Step-level success and latency: success_rate(step), p50/p95/p99 durations for each step.
- Retry and backoff counts: how often steps are retried and whether retries recover.
- Queue and concurrency metrics: queue_depth, active_workers, queue_latency, throttled_requests.
- External dependency metrics: downstream API error-rate and latency as seen by the workflow.
- Dead-letter and discard counts: messages moved to dead-letter queues or dropped.
Keep metrics cardinality controlled: tag by workflow_type, environment, and step_name. Avoid tagging by high-cardinality identifiers such as user_id or request_id in metrics; use logs or traces for those.
Logs (context and debugging)
Emit structured logs with a persistent correlation id for each workflow run. Include: workflow_id, step_name, status, error_class, retry_count, and concise context (e.g., record id, non-sensitive metadata). Use logs to capture payload snapshots sparingly—avoid large or sensitive dumps.
Traces (causal relationships and latency)
Distributed traces are crucial for tracing orchestration across services and steps. Instrument the orchestration layer to propagate a trace / correlation id through each step, and capture spans for external calls and long-running tasks. Sample aggressively for normal runs but increase sampling when errors occur (or use latency/error-based sampling) so you retain traces that help debug failures.
Events and state changes
Emit events for meaningful state transitions: run.started, step.started, step.completed, run.completed, run.failed, run.timed_out, and run.retried. Events are useful for alerting rules, audits, and replaying state in dashboards.
Designing alerts that matter
Not every failing run should page someone. Good alerts escalate only when human action is required or an SLO is at risk. Use a layered alerting approach:
- Noise-level signals (Slack, logs): transient errors, occasional step failures that auto-recover, or single-run anomalies.
- Operational alerts (on-call but not paging): sustained increases in retries, queue growth, or external dependency latency that require investigation but not immediate action.
- Page-worthy incidents: large failure-rate spikes, SLO burn, complete stoppage, or data-loss events.
Translate business impact into alert rules. For example: "If payment-processing failures exceed 3% for 15 minutes AND absolute failures > 20, page ops. If failures are < 3% but trending up with increased retries, send to the workflow owner channel." That combination guards against pages caused by small-volume workflows where a single failure would otherwise trigger a pager.
Practical alerting patterns
- Combine relative and absolute thresholds: require both a rate and a volume condition to fire.
- Prefer sustained windows over instantaneous spikes: use 5–15 minute windows for production alerts.
- Group alerts by root cause: collapse multiple step errors into a single incident when they share the same failure fingerprint (same downstream API or deployment tag).
- Use SLO burn alerts: alert when error budget consumption reaches a threshold (e.g., 50% burn) so teams can triage before user impact is substantial.
Tracing orchestration: how to instrument without breaking performance
Orchestration traces show the flow and timing between steps. Instrument the orchestration layer to create a root span per workflow run and child spans for each step and external call. Important implementation details:
- Propagate a stable correlation id across retries and handoffs so traces join correctly.
- Use selective sampling: keep 100% of error traces, a higher percentage for high-latency runs, and sample normal runs.
- Avoid verbose span payloads—record metadata and error_class, but not complete request/response bodies.
Tracing helps diagnose orchestration-level problems: unexpected serialization delays, misordered retries, or hidden blocking caused by external backpressure.
Avoiding alert noise: practical tactics
Noise reduces trust in alerts. Use these tactics to keep your signal-to-noise ratio high.
1. Tune thresholds with context
Don’t use identical thresholds across workflows. Tailor them to workflow volume and business criticality. Low-volume, high-value workflows deserve stricter SLOs and lower noise tolerance; high-volume non-critical jobs can tolerate looser rules and more aggregation.
2. Require volume minimums
Combine rate-based alerts with an absolute minimum count to avoid firing on small-sample anomalies. Example condition: failure_rate > 5% for 10 minutes AND failures > 10.
3. Suppress during deploys and known maintenance
Integrate deployments and maintenance windows with your alerting system so expected failures don’t page on-call. Record deployment metadata in the workflow runs so correlating alerts with a recent deploy is straightforward.
4. Automated remediation and runbooks
Automate common fixes where safe: restart workers, replay a failed batch, or increase concurrency temporarily. When manual intervention is required, attach a runbook with exact steps and relevant dashboards to the alert to speed resolution and reduce repeated pages for the same error.
5. Use deduplication and correlation
Configure your alerting backend to deduplicate identical errors and group related alerts into incidents. If ten workflows fail for the same downstream API outage, one grouped incident is easier to manage than ten separate pages.
Dashboard and investigative tooling
Dashboards should answer three operational questions quickly: is the system healthy, what is degraded, and what changed recently?
- Overview dashboard: per-workflow success_rate, run_rate, p95 runtime, queue_depth, and SLO burn.
- Drilldown: step-level latencies, retry churn, and external dependency heatmaps.
- Traces & logs view: quick access from any alert to traces and correlated logs filtered by workflow_id or correlation id.
Include deployment and config metadata on dashboards so operators can quickly check for recent changes when incidents begin.
Concrete examples: alert rule templates
Below are conceptual alert rules you can adapt to your monitoring stack.
# Example: page when payment workflow failures exceed 3% and at least 20 failures in 15 minutes
failure_rate = sum(rate(payment_workflow_failed_total[15m])) / sum(rate(payment_workflow_started_total[15m]))
page_if: failure_rate > 0.03 and sum(rate(payment_workflow_failed_total[15m])) > 20

# Example: operational alert for queue growth
page_if: max_over_time(queue_depth{queue="ingest"}[10m]) > 1000 for 10m

# SLO burn alert: error budget burn > 50% in the last 1 hour
slo_burn = (errors_last_1h / allowed_errors_1h)
page_if: slo_burn > 0.5
Adjust window sizes and thresholds to match your risk tolerance and workflow volume.
Operational practices that keep observability useful
- Test alerts in staging and use a dedicated test channel before enabling paging in production.
- Run regular alert reviews: retire noisy alerts, update thresholds, and ensure runbooks remain current.
- Track alert fatigue metrics: mean time to acknowledge, mean time to resolve, and number of distinct alerts per incident.
- Instrument feature flags and workflow versions so you can roll back a problematic change quickly.
A ready checklist to implement today
- Define workflow-level objectives and map them to SLOs.
- Instrument metrics: run counts, success/failure rates, step latencies, retries, queue depth.
- Add structured logs and a persistent correlation id for every run.
- Enable distributed tracing at the orchestration layer with error/latency sampling.
- Create layered alerts: informational, operational, and page-worthy; require both rate and volume conditions for pages.
- Prepare runbooks and automate safe remediation for frequent issues.
- Review alerts monthly and suppress during planned deployments.
Good observability makes failures visible in context. The goal is not to eliminate alerts, but to ensure every alert points to an actionable problem and contains the information the team needs to fix it.
Frequently Asked Questions
What are the most important metrics to monitor for automated workflows?
Track run counts (started, succeeded, failed), step-level latency (p50/p95/p99), retry counts, queue depth and latency, external dependency error rates, and dead-letter counts. Use tags for workflow_type and step_name but avoid high-cardinality identifiers in metrics.
How do I avoid getting paged for transient failures?
Combine relative and absolute thresholds, use sustained windows (5–15 minutes), require minimum failure volumes before paging, suppress alerts during deployments, and route transient issues to a low-priority channel rather than paging on-call.
When should I use traces versus logs for debugging workflow failures?
Use traces to see causal relationships and step timing across services; use logs for detailed context, payload snippets (non-sensitive), and richer error messages. Enable sampling that preserves all error traces and a higher percentage of high-latency runs.
How can I measure whether my alerts are useful or noisy?
Track alert-related metrics such as alerts per incident, mean time to acknowledge, mean time to resolve, and number of duplicate or irrelevant pages. Regularly review and retire noisy alerts and update runbooks tied to alerts.